Taiga Stats - Your Scrum & Kanban Statistics Tool
I will introduce my Python-modernized and brushed-up statistics tool for Scrum & Kanban masters using the online Taiga.io project management board.
TaigaPermalink
First a short introduction. Taiga is an open source project management board. It features what software teams expect in terms of creating stories, managing them in a backlog and visualizing in a Kanban or Scrum board. You can use the official hosted version or run your own company server. This last part is what makes this tool very attractive for business which can’t let company secrets leave their own IT infrastructure. After all, what is in the software team’s backlogs is how a company is going to compete in the market in the next 1-2 years.
Taiga-statsPermalink
Some years ago I worked for a company where a few departments picked up Taiga for their software teams. I was having the Kanban and later the Scrum master role in one of these teams. I soon found that I was making quite a lot of offline calculations and manual work to get insights in to my team’s development progress.
After finding that Taiga has a nice REST (Representational state transfer - as of today the most common way to build inter-service or client-facing APIs. Leveraging the HTTP infrastructure.
) API and that there was already a nice python library python-taiga to access it, I started to hack together a script to automate my tasks. The script grew bigger and bigger and I eventually put it on GitHub at erikw/taiga-stats.
Some features:
- Collect statistics for producing an offline burnup or burndown chart
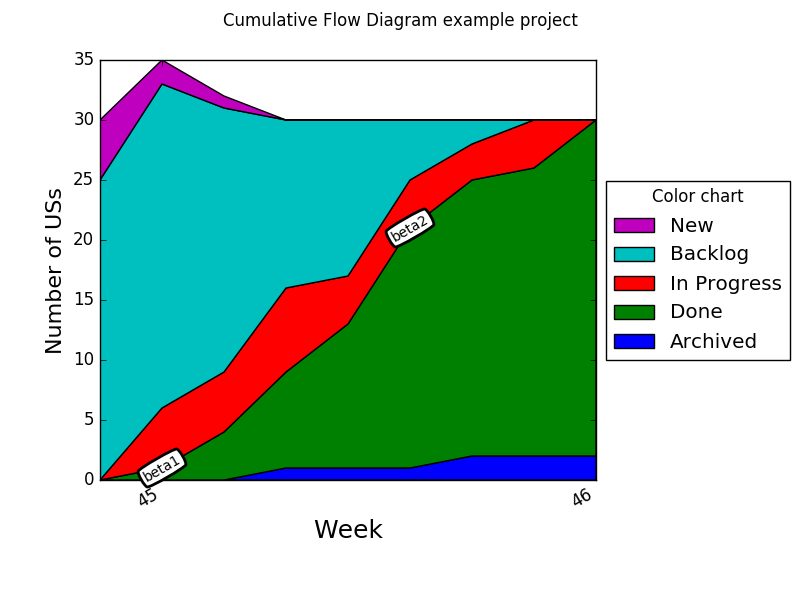
- Generating a CFD (Cumulative Flow Diagram - gives for a project a quick overview of total progress over time.
) image by collecting data points ( cron job (A Unix tool (standard) for scheduling background jobs.
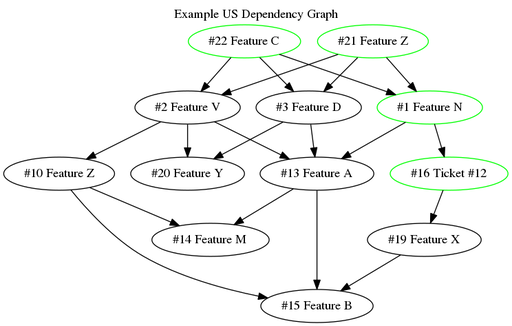
)). - Print dependency graph between user stories.
Examples of the last two features:


Python ModernizationPermalink
State of the PyArtPermalink
Since I wrote this tool (script) a lot has happened in the Python world. Even since I worked as a Python developer a few years ago, the Python setup on my computer is rather different! This project used the old-school requirements.txt file to install dependencies, and the cumbersome virtualenv was used manually to setup a shielded environment for the project.
I did quite a bit of research to find out what the state of the art in Python is as of today and I landed with using:
- pyenv - to manage different Python versions on my system.
- Poetry - to manage a project’s dependencies and packaging.
As I’ve lately been working quite a bit with ruby (see earlier blog posts here and here) these two tools met my expectation from the fantastic ruby world. pyenv even being a fork of rbenv and Poetry clearly taking a lot of inspiration from Bundler.
The competitor to Poetry would be Pipenv. However I found some technical issues and also some concerns about how the project is managed and went for Poetry which seemed healthier to me.
taiga-stats 1.xPermalink
I migrated my old project to Poetry and some benefits are:
- Published to PyPi! A user does not need to follow the developer setup with virtualenvs etc. A user can now simply
$ pip install taiga-statsand go! - More precis dependency specification and pinning.
- Modularization of the code. It was all in one source file but is now split up to modules.
- Code is cleaned up with nice tools like flake8, black, isort etc.
- Added all expected files in modern open source projects like CHANGELOG, .editorconfig etc.
I present to you, the fresh taiga-stats. Compare before and after.
Here is the CLI interface (as of the time of writing):
1
2
3
4
5
6
7
8
9
10
11
12
13
14
15
16
17
18
19
20
21
22
23
24
25
26
27
28
29
30
31
32
33
34
35
36
37
38
39
40
41
42

$ pip install taiga-stats
$ taiga-stats --help
usage: taiga-stats [-h] [-v] [--url URL] [--auth-token AUTH_TOKEN]
                   {config_template,list_projects,list_us_statuses,burnup,store_daily,points_sum,cfd,deps_dot_nodes,deps_dot}
                   ...

Taiga statistic tool. Default values for many options can be set config file;
see the command 'config_template'.

positional arguments:
  {config_template,list_projects,list_us_statuses,burnup,store_daily,points_sum,cfd,deps_dot_nodes,deps_dot}
                        Commands. Run $(taiga-stats <command> -h) for more
                        info about a command.
    config_template     Generate a template configuration file.
    list_projects       List all found project IDs and names on the server
                        that you have access to read.
    list_us_statuses    List all the ID and names of User Story statuses.
    burnup              Print burn(up|down) statistics. Typically used for
                        entering in an Excel sheet or such that plots a
                        burnup.
    store_daily         Store the current state of a project on file so that
                        the CFD command can generate a diagram with this data.
    points_sum          Print out the sum of points in User Story statuses.
    cfd                 Generate a Cumulative Flow Diagram from stored data.
    deps_dot_nodes      Print User Story nodes in .dot file format.
    deps_dot            Print US in .dot file format with dependencies too!
                        Create a custom attribute for User Stories named
                        'Depends On' by going to Settings>Attributes>Custom
                        Fields. Then go to a User Story and put in a comma
                        separated list of stories that this story depends on
                        e.g. '#123,#456'.

optional arguments:
  -h, --help            show this help message and exit
  -v, --version         show program's version number and exit
  --url URL             URL to Taiga server.
  --auth-token AUTH_TOKEN
                        Authentication token. Instructions on how to get one
                        is found at
                        https://docs.taiga.io/api.html#_authentication

Support: please go to https://github.com/erikw/taiga-stats/issues


Leave a comment
Your email address will not be published. Required fields are marked *